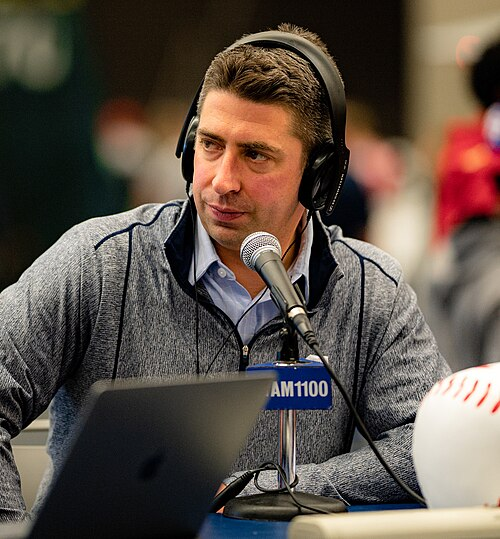
Mike Chernoff
★ activeBorn 1980 · age 46
General manager for the Guardians (2016–present).
Across the full 11-season sample, the measured profile stands out most for payroll-adjusted roster quality (97th percentile), championship leverage per acquired WAR (96th percentile), and cheap-talent surplus (95th percentile).
11 seasons with salary-era data across 1 stint. All figures are franchise-level outcomes during the tenure, not solely attributable to one executive.
1 pennant · 8 playoff appearances · 928–750 (0.553)
Overview
| Team | Role | Year | Pay $M |
Rel Pay |
Surp $M |
Surp WAR |
Dead % |
Cheap $M |
Draft $M |
Trd $M |
Int'l $M |
$ / WAR |
WAR | Depth | Dead WAR |
HG | Trade | Net/ Trd |
FA | R5 | RFA | PPA | CPA | WAB | TAB | W-L% | PO | Pen | WS |
|---|---|---|---|---|---|---|---|---|---|---|---|---|---|---|---|---|---|---|---|---|---|---|---|---|---|---|---|---|---|
 Guardians |
GM | 2016 94–67 | $82 | 65 | +54 | +16.7 | 34% | +70 | +30 | +17 | +23 | $1.8M | 41.8 | 8.0 | -3.4 | +30.5 | -1.2 | -0.41 | -2.8 | -9.4 | +0.39 | 5.71 | 0.36 | +17.9 | +12.9 | 0.584 | ✓ | ✓ | |
| Guardians |
GM | 2017 102–60 | $122 | 93 | +79 | +23.4 | 19% | +65 | +21 | +17 | +27 | $2.0M | 58.6 | 11.0 | -1.9 | +4.0 | +0.2 | +0.06 | -1.6 | +0.0 | -2.52 | 0.95 | 1.80 | +20.9 | +25.2 | 0.630 | ✓ | ||
| Guardians |
GM | 2018 91–71 | $143 | 109 | +20 | +5.9 | 38% | +54 | +23 | +8 | +23 | $2.7M | 47.8 | 9.0 | -5.4 | -0.1 | -17.3 | -1.93 | -18.2 | +0.0 | +0.02 | 3.16 | 1.09 | +7.9 | +12.5 | 0.562 | ✓ | ||
| Guardians |
GM | 2019 93–69 | $125 | 96 | +23 | +7.1 | 26% | +57 | +40 | +17 | +0 | $2.5M | 45.1 | 9.0 | -4.5 | +0.0 | +1.2 | +0.25 | -2.9 | +0.0 | +0.92 | 6.44 | 0.58 | +11.5 | +11.4 | 0.574 | |||
| Guardians |
GM | 2020 35–25 | $87 | 74 | +43 | +5.9 | 19% | +38 | +40 | -2 | +0 | $4.2M | 17.9 | 2.0 | -2.7 | +0.0 | -0.4 | -0.44 | -1.8 | +2.1 | +1.96 | 3.41 | 1.09 | +0.0 | +0.0 | 0.583 | ✓ | ||
| Guardians |
GM | 2021 80–82 | $45 | 36 | +46 | +14.3 | 53% | +49 | +20 | +29 | +0 | $1.4M | 28.5 | 5.0 | -3.7 | +0.0 | +17.8 | +2.54 | +1.7 | +0.0 | +0.49 | 0.26 | 0.06 | +11.1 | +6.6 | 0.494 | |||
| Guardians |
GM | 2022 92–70 | $65 | 45 | +86 | +23.5 | 22% | +84 | +34 | +49 | +0 | $1.4M | 40.7 | 8.0 | -6.6 | +27.2 | -3.1 | -0.52 | -0.6 | +0.0 | +0.06 | 6.81 | 0.60 | +20.1 | +16.0 | 0.568 | ✓ | ||
| Guardians |
GM | 2023 76–86 | $93 | 60 | +22 | +5.6 | 51% | +41 | +2 | +27 | +0 | $2.6M | 28.9 | 7.0 | -6.1 | +24.9 | +0.7 | +0.10 | -4.4 | +0.0 | +1.20 | 1.22 | 0.14 | +0.5 | +0.8 | 0.469 | |||
| Guardians |
GM | 2024 92–69 | $91 | 57 | +57 | +13.6 | 42% | +67 | -9 | +13 | +0 | $2.3M | 35.6 | 7.0 | -4.1 | +16.6 | -4.1 | -0.46 | -4.7 | +0.0 | +0.14 | 3.18 | 0.23 | +17.8 | +8.4 | 0.571 | ✓ | ||
| Guardians |
GM | 2025 88–74 | $80 | 51 | +33 | +8.2 | 43% | +36 | -2 | -2 | +0 | $2.4M | 28.8 | 3.0 | -4.6 | +5.4 | +0.2 | +0.06 | +0.6 | +0.0 | +0.75 | 0.60 | 0.10 | +14.5 | +2.6 | 0.543 | ✓ | ||
| Guardians |
GM | 2026 85–77 | $72 | 45 | +88 | +21.1 | 24% | +91 | +0 | +7 | +0 | $1.8M | 38.2 | 9.0 | -3.2 | +6.1 | +0.0 | +0.00 | -3.5 | +0.0 | +0.10 | 3.90 | 0.26 | +13.3 | +13.7 | 0.525 | ✓ | ||
| Career total (1985+ data) | $1006 | 67 | +553 | +145.3 | 34% | +59 | +18 | +16 | +7 | $2.2M | 411.9 | 7.1 | -4.2 | +114.7 | -6.1 | -0.11 | -38.1 | -7.2 | +0.33 | 3.11 | 0.63 | +135.6 | +110.1 | 0.553 | 8 | 1 | – | ||
Roster Construction
Build channels — net fWAR
Acquired minus surrendered / signed minus walked.
Trades
Trades made — 0 deals credited to Mike Chernoff, best expected value first; surplus is realized value in $M
No graded trades on record for this executive.
Players acquired — 172 players, by realized fWAR for the franchise (scroll for more)
| Player | Pos | Team | How | Year | Szns | fWAR | WAR/yr | RFA | PPA | CPA |
|---|---|---|---|---|---|---|---|---|---|---|
| Shane Bieber | P | CLE |
Draft | 2016 | 7 | +21.5 | +3.1 | – | – | – |
| Steven Kwan | OF | CLE |
Draft | 2022 | 5 | +18.7 | +3.7 | – | – | – |
| Andrés Giménez | 2B | CLE |
Trade | 2021 | 4 | +13.3 | +3.3 | +4.22 | 0.2% | 0.04% |
| Tanner Bibee | P | CLE |
Draft | 2023 | 4 | +9.7 | +2.4 | – | – | – |
| Emmanuel Clase | P | CLE |
Trade | 2021 | 5 | +9.6 | +1.9 | – | 0.5% | 0.14% |
| Cade Smith | P | CLE |
Draft | 2024 | 3 | +8.0 | +2.7 | – | – | – |
| Gavin Williams | P | CLE |
Draft | 2023 | 4 | +7.3 | +1.8 | – | – | – |
| Josh Naylor | 1B | CLE |
Trade | 2021 | 4 | +7.0 | +1.8 | +1.96 | 0.1% | 0.02% |
| Parker Messick | P | CLE |
Draft | 2025 | 2 | +5.9 | +3.0 | – | – | – |
| Amed Rosario | SS | CLE |
Trade | 2021 | 3 | +5.9 | +2.0 | +4.22 | 0.7% | 0.17% |
| Bo Naylor | C | CLE |
Draft | 2022 | 3 | +4.9 | +1.6 | – | – | – |
| Cal Quantrill | P | CLE |
Trade | 2020 | 4 | +4.9 | +1.2 | +1.96 | 2.0% | 0.63% |
| Aaron Civale | P | CLE |
Draft | 2016 | 5 | +4.6 | +0.9 | – | – | – |
| Brayan Rocchio | SS | CLE |
Draft | 2023 | 3 | +4.6 | +1.5 | – | – | – |
| Zach Plesac | P | CLE |
Draft | 2016 | 5 | +4.4 | +0.9 | – | – | – |
| Joey Cantillo | P | CLE |
Draft | 2024 | 3 | +4.0 | +1.3 | – | – | – |
| Edwin Encarnación | 1B/3B/DH | CLE |
Free agency | 2017 | 2 | +3.9 | +1.9 | – | 2.4% | 4.70% |
| Andrew Miller | P | CLE |
Trade | 2016 | 3 | +3.7 | +1.2 | – | 6.1% | 0.39% |
| Chase DeLauter | DH/OF | CLE |
Draft | 2026 | 1 | +3.5 | +3.5 | – | – | – |
| Travis Bazzana | 2B | CLE |
Draft | 2026 | 1 | +2.8 | +2.8 | – | – | – |
| Brad Hand | P | CLE |
Trade | 2018 | 3 | +2.7 | +0.9 | -0.17 | 1.5% | 0.51% |
| Logan Allen | P | CLE |
Draft | 2023 | 2 | +2.6 | +1.3 | – | – | – |
| Jordan Luplow | OF | CLE |
Trade | 2018 | 3 | +2.6 | +0.9 | +0.01 | 15.8% | 1.36% |
| Austin Hedges | C | CLE |
Free agency | 2023 | 4 | +2.5 | +0.6 | – | 0.1% | 0.02% |
| Hunter Gaddis | P | CLE |
Draft | 2022 | 4 | +2.4 | +0.6 | – | – | – |
| James Karinchak | P | CLE |
Draft | 2017 | 4 | +2.2 | +0.5 | – | – | – |
| Daniel Schneemann | 2B/OF | CLE |
Draft | 2024 | 3 | +2.2 | +0.7 | – | – | – |
| Óscar Mercado | OF | CLE |
Trade | 2018 | 2 | +2.1 | +1.1 | +0.00 | – | – |
| Óliver Pérez | P | CLE |
Free agency | 2018 | 4 | +2.1 | +0.5 | – | 3.3% | 1.12% |
| Trevor Stephan | P | CLE |
Rule 5 | 2020 | 2 | +2.1 | +1.1 | – | – | – |
| César Hernández | 2B | CLE |
Free agency | 2019 | 2 | +1.9 | +0.9 | – | 16.9% | 5.39% |
| Austin Jackson | OF | CLE |
Free agency | 2017 | 1 | +1.9 | +1.9 | – | 1.8% | 3.35% |
| Erik Sabrowski | P | CLE |
Draft | 2024 | 3 | +1.9 | +0.6 | – | – | – |
| Enyel De Los Santos | P | CLE |
Free agency | 2021 | 2 | +1.7 | +0.9 | – | 6.6% | 0.58% |
| Eli Morgan | P | CLE |
Draft | 2017 | 4 | +1.7 | +0.4 | – | – | – |
| Myles Straw | OF | CLE |
Trade | 2021 | 4 | +1.7 | +0.4 | +0.20 | 0.5% | 0.13% |
| Angel Martínez | OF | CLE |
Draft | 2024 | 1 | +1.6 | +1.6 | – | – | – |
| Franmil Reyes | DH/OF | CLE |
Trade | 2020 | 2 | +1.6 | +0.8 | +4.07 | 7.2% | 2.29% |
| Dan Otero | P | CLE |
Trade | 2016 | 2 | +1.5 | +0.8 | – | 8.9% | 0.56% |
| Slade Cecconi | P | CLE |
Trade | 2024 | 2 | +1.4 | +0.7 | +0.30 | 0.4% | 0.07% |
| Matt Festa | P | CLE |
Trade | 2025 | 2 | +1.4 | +0.7 | – | 0.5% | 0.08% |
| Mike Napoli | C/1B | CLE |
Free agency | 2016 | 1 | +1.2 | +1.2 | – | 6.8% | 0.43% |
| Yasiel Puig | OF | CLE |
Trade | 2019 | 1 | +1.2 | +1.2 | +4.07 | 7.6% | 0.69% |
| Patrick Bailey | C | CLE |
Trade | 2026 | 1 | +1.2 | +1.2 | +0.27 | 4.6% | 0.30% |
| Gabriel Arias | SS | CLE |
Draft | 2022 | 3 | +1.1 | +0.4 | – | – | – |
| Ben Lively | P | CLE |
Free agency | 2023 | 2 | +1.1 | +0.6 | – | 2.5% | 0.18% |
| Mike Freeman | 2B | CLE |
Free agency | 2018 | 2 | +1.0 | +0.5 | – | 6.1% | 0.55% |
| David Fry | DH | CLE |
Trade | 2022 | 2 | +1.0 | +0.5 | +0.14 | – | – |
| Kyle Manzardo | 1B/DH | CLE |
Trade | 2023 | 2 | +1.0 | +0.5 | +0.97 | – | – |
| Matt Boyd | P | CLE |
Free agency | 2024 | 1 | +0.9 | +0.9 | – | 2.8% | 0.20% |
| Tyler Olson | P | CLE |
Trade | 2017 | 3 | +0.9 | +0.3 | – | 0.5% | 0.93% |
| Luis Ortiz | P | CLE |
Trade | 2025 | 1 | +0.9 | +0.9 | -0.39 | 0.5% | 0.09% |
| Tim Herrin | P | CLE |
Draft | 2023 | 3 | +0.8 | +0.3 | – | – | – |
| Colin Holderman | P | CLE |
Free agency | 2025 | 1 | +0.8 | +0.8 | – | 3.1% | 0.20% |
| Will Brennan | OF | CLE |
Draft | 2022 | 2 | +0.7 | +0.4 | – | – | – |
| Tyler Clippard | P | CLE |
Free agency | 2019 | 1 | +0.7 | +0.7 | – | 4.4% | 0.40% |
| Luke Maile | C | CLE |
Free agency | 2022 | 1 | +0.7 | +0.7 | – | 4.7% | 0.42% |
| Phil Maton | P | CLE |
Trade | 2019 | 3 | +0.7 | +0.2 | +0.58 | 0.4% | 0.03% |
| Foster Griffin | P | CLE |
Trade | 2026 | 1 | +0.7 | +0.7 | -0.70 | 2.8% | 0.19% |
| Kolby Allard | P | CLE |
Free agency | 2025 | 1 | +0.6 | +0.6 | – | 0.4% | 0.07% |
| Tyler Freeman | OF | CLE |
Draft | 2022 | 3 | +0.6 | +0.2 | – | – | – |
| Jakob Junis | P | CLE |
Free agency | 2025 | 1 | +0.6 | +0.6 | – | 0.3% | 0.06% |
| Kevin Plawecki | C | CLE |
Trade | 2019 | 1 | +0.6 | +0.6 | +0.25 | 3.6% | 0.33% |
| Rajai Davis | OF | CLE |
Trade | 2016 | 1 | +0.6 | +0.6 | – | 6.4% | 0.41% |
| Jay Bruce | OF | CLE |
Trade | 2017 | 1 | +0.6 | +0.6 | – | 0.6% | 1.07% |
| Ramón Laureano | OF | CLE |
Trade | 2023 | 1 | +0.6 | +0.6 | – | 1.0% | 0.11% |
| Nick Goody | P | CLE |
Trade | 2016 | 2 | +0.5 | +0.2 | +0.30 | 0.6% | 1.15% |
| Jefry Rodríguez | P | CLE |
Trade | 2018 | 1 | +0.5 | +0.5 | +0.10 | 3.0% | 0.28% |
| Josh Donaldson | 3B | CLE |
Trade | 2018 | 1 | +0.5 | +0.5 | – | 1.7% | 0.58% |
| Jo Adell | OF | CLE |
Trade | 2026 | 1 | +0.5 | +0.5 | -0.18 | 1.9% | 0.13% |
| Reynaldo López | P | CLE |
Trade | 2023 | 1 | +0.4 | +0.4 | – | 0.4% | 0.05% |
| Adam Cimber | P | CLE |
Trade | 2018 | 2 | +0.3 | +0.2 | -0.17 | 1.4% | 0.13% |
| Alex Cobb | P | CLE |
Trade | 2024 | 1 | +0.3 | +0.3 | – | 0.9% | 0.06% |
| Xzavion Curry | P | CLE |
Draft | 2022 | 1 | +0.3 | +0.3 | – | – | – |
| Boone Logan | P | CLE |
Free agency | 2017 | 1 | +0.3 | +0.3 | – | 0.3% | 0.54% |
| Konnor Pilkington | P | CLE |
Draft | 2022 | 2 | +0.3 | +0.1 | – | – | – |
| Tommy Hunter | P | CLE |
Trade | 2016 | 1 | +0.3 | +0.3 | – | 1.7% | 0.11% |
| Pedro Avila | P | CLE |
Trade | 2024 | 1 | +0.3 | +0.3 | +0.41 | 0.8% | 0.06% |
| Ernie Clement | 2B/3B | CLE |
Draft | 2017 | 1 | +0.2 | +0.2 | – | – | – |
| Nic Enright | P | CLE |
Draft | 2025 | 1 | +0.2 | +0.2 | – | – | – |
| Brandon Guyer | OF | CLE |
Trade | 2016 | 2 | +0.2 | +0.1 | +0.75 | 5.7% | 0.36% |
| Nolan Jones | OF | CLE |
Draft | 2022 | 1 | +0.2 | +0.2 | – | – | – |
| Michael Kelly | P | CLE |
Free agency | 2023 | 1 | +0.2 | +0.2 | – | 0.3% | 0.03% |
| Blake Parker | P | CLE |
Free agency | 2021 | 1 | +0.2 | +0.2 | – | 0.1% | 0.02% |
| Brad Miller | SS | CLE |
Trade | 2019 | 1 | +0.2 | +0.2 | – | 1.2% | 0.11% |
| Eddie Rosario | OF | CLE |
Trade | 2021 | 1 | +0.2 | +0.2 | – | 0.1% | 0.02% |
| A. J. Cole | P | CLE |
Trade | 2019 | 1 | +0.2 | +0.2 | – | 1.4% | 0.13% |
| Yonder Alonso | 1B | CLE |
Free agency | 2017 | 1 | +0.1 | +0.1 | – | 0.3% | 0.09% |
| Brandon Barnes | OF | CLE |
Free agency | 2017 | 1 | +0.1 | +0.1 | – | 0.4% | 0.13% |
| Peyton Battenfield | P | CLE |
Draft | 2023 | 1 | +0.1 | +0.1 | – | – | – |
| Marlon Byrd | OF | CLE |
Free agency | 2016 | 1 | +0.1 | +0.1 | – | 0.4% | 0.03% |
| Zack Collins | C | CLE |
Free agency | 2023 | 1 | +0.1 | +0.1 | – | 0.1% | 0.01% |
| Delino DeShields | OF | CLE |
Trade | 2019 | 1 | +0.1 | +0.1 | +1.05 | 0.6% | 0.18% |
| Estevan Florial | OF | CLE |
Trade | 2023 | 1 | +0.1 | +0.1 | +1.91 | 0.2% | 0.01% |
| Perci Garner | P | CLE |
Trade | 2016 | 1 | +0.1 | +0.1 | – | – | – |
| Connor Gillispie | P | CLE |
Draft | 2024 | 1 | +0.1 | +0.1 | – | – | – |
| Petey Halpin | OF | CLE |
Draft | 2025 | 2 | +0.1 | +0.1 | – | – | – |
| Codi Heuer | P | CLE |
Free agency | 2025 | 1 | +0.1 | +0.1 | – | 0.2% | 0.01% |
| Zak Kent | P | CLE |
Trade | 2024 | 1 | +0.1 | +0.1 | +0.17 | – | – |
| Ryan Lavarnway | C | CLE |
Free agency | 2019 | 1 | +0.1 | +0.1 | – | 0.0% | 0.00% |
| Evan Marshall | P | CLE |
Free agency | 2017 | 1 | +0.1 | +0.1 | – | 0.4% | 0.13% |
| Adam Rosales | 2B/3B/SS | CLE |
Free agency | 2018 | 1 | +0.1 | +0.1 | – | 0.3% | 0.11% |
| Peter Strzelecki | P | CLE |
Trade | 2024 | 1 | +0.1 | +0.1 | – | 0.2% | 0.01% |
| René Rivera | C | CLE |
Trade | 2021 | 1 | +0.1 | +0.1 | – | 0.0% | 0.00% |
| Craig Breslow | P | CLE |
Trade | 2017 | 1 | +0.1 | +0.1 | – | 0.1% | 0.17% |
| Joba Chamberlain | P | CLE |
Trade | 2016 | 1 | +0.1 | +0.1 | – | 0.6% | 0.04% |
| Nick Wittgren | P | CLE |
Trade | 2019 | 2 | +0.1 | +0.1 | -0.14 | 2.6% | 0.24% |
| Paul Sewald | P | CLE |
Trade | 2025 | 1 | +0.1 | +0.1 | – | 0.1% | 0.01% |
| Wes Parsons | P | CLE |
Trade | 2024 | 1 | +0.1 | +0.1 | – | 0.3% | 0.02% |
| Scott Barlow | P | CLE |
Trade | 2023 | 1 | +0.0 | +0.0 | -0.77 | 0.1% | 0.01% |
| Melky Cabrera | OF | CLE |
Free agency | 2018 | 1 | +0.0 | +0.0 | – | 0.1% | 0.05% |
| Oscar González | OF | CLE |
Draft | 2022 | 1 | -0.0 | -0.0 | – | – | – |
| Carlos Hernández | P | CLE |
Free agency | 2025 | 1 | -0.0 | -0.0 | – | 0.0% | 0.00% |
| James Hoyt | P | CLE |
Trade | 2018 | 1 | +0.0 | +0.0 | -0.05 | 0.0% | 0.00% |
| CJ Kayfus | 1B/OF | CLE |
Draft | 2025 | 1 | -0.0 | -0.0 | – | – | – |
| Sandy León | C | CLE |
Free agency | 2021 | 1 | +0.0 | +0.0 | – | 0.2% | 0.02% |
| Owen Miller | 1B/2B | CLE |
Trade | 2020 | 1 | -0.0 | -0.0 | +1.96 | – | – |
| Doug Nikhazy | P | CLE |
Draft | 2025 | 1 | +0.0 | +0.0 | – | – | – |
| Dom Nuñez | C | CLE |
Free agency | 2024 | – | -0.0 | – | – | – | – |
| Andrew Walters | P | CLE |
Draft | 2024 | 1 | +0.0 | +0.0 | – | – | – |
| Matt Moore | P | CLE |
Trade | 2023 | 1 | +0.0 | +0.0 | – | 0.1% | 0.01% |
| Oliver Drake | P | CLE |
Trade | 2018 | 1 | +0.0 | +0.0 | – | 0.1% | 0.04% |
| Hunter Wood | P | CLE |
Trade | 2019 | 1 | +0.0 | +0.0 | +0.61 | 0.1% | 0.01% |
| Christian Arroyo | 2B | CLE |
Trade | 2020 | 1 | +0.0 | +0.0 | +0.61 | 0.0% | 0.00% |
| Stuart Fairchild | OF | CLE |
Trade | 2026 | 1 | +0.0 | +0.0 | – | 0.1% | 0.01% |
| Ian Gibaut | P | CLE |
Trade | 2022 | 1 | +0.0 | +0.0 | – | 0.0% | 0.00% |
| Cody Bolton | P | CLE |
Trade | 2025 | 1 | +0.0 | +0.0 | – | 0.0% | 0.00% |
| Anthony Gose | OF | CLE |
Free agency | 2019 | 1 | -0.1 | -0.1 | – | 0.1% | 0.01% |
| Bryan Lavastida | C | CLE |
Draft | 2022 | – | -0.1 | – | – | – | – |
| Dominic Leone | P | CLE |
Free agency | 2020 | – | -0.1 | – | – | – | – |
| Sandy León | C | CLE |
Trade | 2019 | 1 | -0.1 | -0.1 | – | 0.2% | 0.02% |
| Cody Morris | P | CLE |
Draft | 2022 | 1 | -0.1 | -0.1 | – | – | – |
| Kyle Nelson | P | CLE |
Draft | 2017 | – | -0.1 | – | – | – | – |
| Alexi Ogando | P | CLE |
Free agency | 2017 | – | -0.1 | – | – | – | – |
| Peyton Pallette | P | CLE |
Draft | 2026 | – | -0.1 | – | – | – | – |
| Nick Sandlin | P | CLE |
Draft | 2018 | 2 | -0.1 | -0.0 | – | – | – |
| Tanner Tully | P | CLE |
Draft | 2022 | – | -0.1 | – | – | – | – |
| Meibrys Viloria | C | CLE |
Free agency | 2022 | – | -0.1 | – | – | – | – |
| Alex Young | P | CLE |
Trade | 2022 | 1 | -0.1 | -0.1 | – | 0.1% | 0.01% |
| Tyler Beede | P | CLE |
Free agency | 2024 | – | -0.2 | – | – | – | – |
| Ryan Flaherty | 2B/3B | CLE |
Free agency | 2019 | – | -0.2 | – | – | – | – |
| Daniel Johnson | OF | CLE |
Trade | 2018 | – | -0.2 | – | +0.10 | – | – |
| Max Moroff | 2B/SS | CLE |
Trade | 2018 | – | -0.2 | – | +0.01 | – | – |
| Hanley Ramírez | SS | CLE |
Free agency | 2019 | – | -0.2 | – | – | – | – |
| Neil Ramírez | P | CLE |
Free agency | 2017 | – | -0.2 | – | – | – | – |
| Domingo Santana | OF | CLE |
Free agency | 2020 | – | -0.2 | – | – | – | – |
| Beau Taylor | C | CLE |
Free agency | 2019 | – | -0.2 | – | – | – | – |
| José Tena | 3B | CLE |
Draft | 2023 | – | -0.2 | – | – | – | – |
| Michael Martínez | 2B/OF | CLE |
Trade | 2017 | 1 | -0.2 | -0.2 | – | 0.1% | 0.19% |
| Leonys Martín | OF | CLE |
Trade | 2018 | 1 | -0.2 | -0.2 | +0.00 | 0.7% | 0.24% |
| Lane Thomas | OF | CLE |
Trade | 2024 | 1 | -0.2 | -0.2 | -0.48 | 1.2% | 0.09% |
| Jeff Beliveau | P | CLE |
Free agency | 2017 | – | -0.3 | – | – | – | – |
| Connor Brogdon | P | CLE |
Free agency | 2025 | – | -0.3 | – | – | – | – |
| Jon Edwards | P | CLE |
Free agency | 2018 | – | -0.3 | – | – | – | – |
| Daniel Norris | P | CLE |
Free agency | 2023 | – | -0.3 | – | – | – | – |
| Dan Robertson | OF | CLE |
Free agency | 2016 | – | -0.3 | – | – | – | – |
| George Valera | DH/OF | CLE |
Draft | 2025 | 1 | -0.3 | -0.3 | – | – | – |
| Mike Zunino | C | CLE |
Free agency | 2022 | – | -0.3 | – | – | – | – |
| Logan Allen | P | CLE |
Trade | 2019 | 2 | -0.3 | -0.2 | +4.07 | 0.4% | 0.03% |
| Will Benson | OF | CLE |
Draft | 2022 | – | -0.4 | – | – | – | – |
| Rhys Hoskins | 1B | CLE |
Free agency | 2026 | – | -0.4 | – | – | – | – |
| Richie Palacios | 2B/OF | CLE |
Draft | 2022 | – | -0.4 | – | – | – | – |
| Anthony Castro | P | CLE |
Trade | 2022 | – | -0.5 | – | +0.11 | – | – |
| Nolan Jones | OF | CLE |
Trade | 2025 | 1 | -0.5 | -0.5 | +1.09 | – | – |
| Jhonkensy Noel | OF | CLE |
Draft | 2024 | 1 | -0.5 | -0.5 | – | – | – |
| Juan Uribe | 3B/SS | CLE |
Free agency | 2016 | – | -0.5 | – | – | – | – |
| Will Wilson | 2B/3B | CLE |
Draft | 2025 | – | -0.5 | – | – | – | – |
| Bryan Shaw | P | CLE |
Free agency | 2021 | 5 | -0.6 | -0.1 | – | 2.6% | 0.20% |
| Cam Gallagher | C | CLE |
Free agency | 2023 | – | -0.7 | – | – | – | – |
| Johnathan Rodríguez | OF | CLE |
Draft | 2024 | – | -0.7 | – | – | – | – |
| Jake Bauers | 1B/OF | CLE |
Trade | 2018 | – | -0.8 | – | -0.05 | – | – |
| Kirk McCarty | P | CLE |
Draft | 2022 | – | -0.8 | – | – | – | – |
Trade-side columns: RFA is playoff-readiness percentage points added to the future roster foundation. It grades the franchise's entire side of a trade, so the same score repeats for every player acquired in that package. PPA/CPA remain player-level arrival-year probability points.
WAB = wins above what the team's payroll predicted (resource-controlled). WAR surplus = era-neutral value (WAR minus payroll in win-equivalents). Roster surplus $M = dollar value of WAR over cost. Build channels (realized fWAR): HG = home-grown via amateur draft / international signing; Trade = acquired minus surrendered (incl. purchases/waivers); FA = signed minus walked; R5 = Rule-5 / minor-league-draft pickups. Credit follows the acquisition year — home-grown to the regime at the player's draft/signing (not whoever was in the chair when he peaked), trade/FA/R5 to the GM who made the move. Players acquired as prospects before debuting (e.g. Smoltz, Bagwell; Rule-5 picks like Uggla) are counted as trade/R5, not home-grown. All are franchise-level outcomes during the stint, not solely attributable to one executive.