How many games a team won above what its payroll predicted — a resource-controlled, era-neutral scorecard for front-office performance.
WAB separates did you win? from did you win for your budget? A 75-win team on a bottom-three payroll can out-WAB a 90-win team that bought its way there.
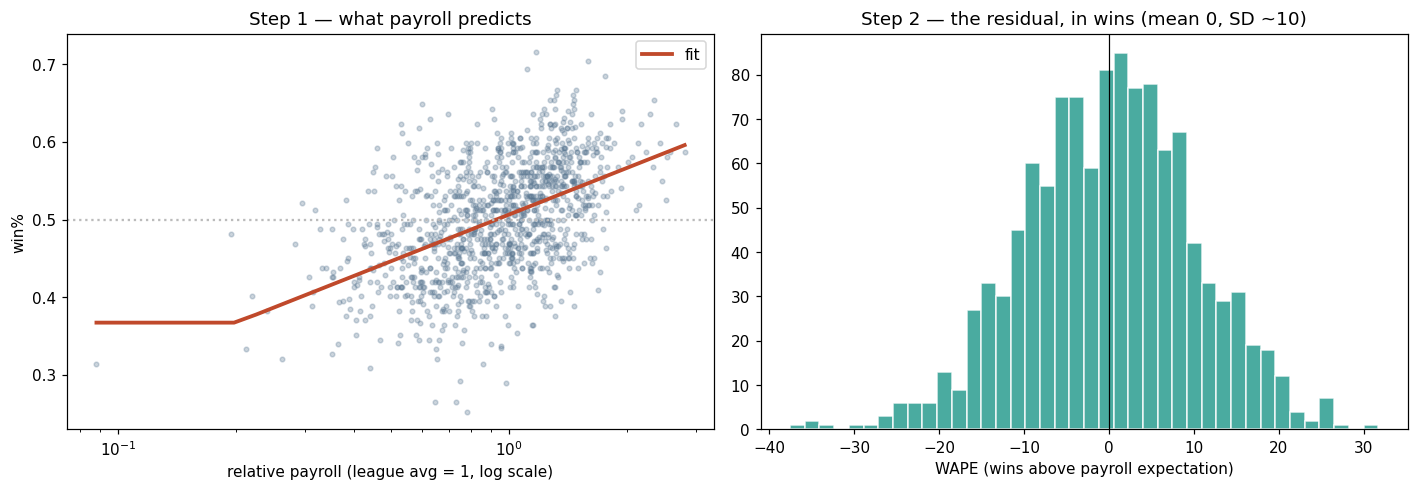
Across every full team-season (1985–2024), regress win% (call it \(p\)) on relative payroll — a team's payroll divided by that season's league-average payroll, so the measure cancels decades of salary inflation:
\[ p = a + b\,\ln(\text{relpay}), \qquad \text{relpay}=\frac{\text{team payroll}}{\text{league-avg payroll that year}} \]A team's WAB is its win-residual, scaled to its games \(G\):
\[ \text{WAB} = \big(p_\text{actual} - [\,a + b\,\ln(\text{relpay})\,]\big)\times G \]Fitted on the data: win% = 0.507 + 0.086·ln(relpay) — about 10 wins per doubling of payroll; WAB has SD ≈ 10 wins.
Every full team-season (1985–2025) bucketed by its WAB that year, and how often each bucket reached the playoffs, the pennant, and the title:
| WAB that season | team-seasons | made playoffs | won pennant | won WS |
|---|---|---|---|---|
| > +15 | 80 | 82% | 25% | 10% |
| +5 to +15 | 277 | 62% | 16% | 8% |
| −5 to +5 | 444 | 16% | 3% | 2% |
| −15 to −5 | 280 | 0% | 0% | 0% |
| < −15 | 77 | 0% | 0% | 0% |
Sharply monotonic for reaching October: a single +15 WAB season is an 82% playoff team, while anything below −5 essentially never makes it. The WS column compresses hard (10% at the top) — the "coin flip" tax again.
Inputs: 103–59 → \(G=162\), win% = 103/162 = 0.636. A bottom-tier payroll — about 0.70× the league average that season → relpay = 0.70.
1. \(\ln(0.70) = -0.357\)
2. predicted win% \(= 0.507 + 0.086\times(-0.357) = 0.476\) (≈ a 77-win team)
3. \(\text{WAB} = (0.636 - 0.476)\times 162 = \mathbf{+25.9}\)
The A's won ~27 games more than their bottom-tier payroll predicted — the Moneyball season in one number.
Fit on full team-seasons (≥100 games), 1985–2024/25. All figures are franchise-level outcomes credited to the decision-maker in the relevant year — see the GM profiles for per-executive numbers.