How much roster talent a team assembled above what its payroll predicted — the roster-construction half of front-office skill.
WAB asks "did the wins show up?"; TAB asks "did you build the talent?" They differ by exactly one thing — the luck in converting talent into wins (run sequencing, one-run games, bullpen timing) — so WAB − TAB is that conversion luck, and TAB strips it out. That makes TAB the cleaner, stickier read on the executive. (It isn't fully luck-proof: an injury lowers a player's WAR, so injuries hit TAB and WAB alike — TAB only removes the conversion layer.)
Same setup as WAB, but the response is the team's season-pace roster WAR instead of win%:
\[ \text{WAR}_{162} = \text{teamWAR}\times\frac{162}{G}, \qquad \text{WAR}_{162} = a_w + b_w\,\ln(\text{relpay}) \] \[ \text{TAB} = \text{WAR}_{162} - [\,a_w + b_w\,\ln(\text{relpay})\,] \]Fitted: WAR₁₆₂ = 34.3 + 13.0·ln(relpay). Because WAR is built from hundreds of plate appearances and innings, it is far less noisy than W–L record — so TAB is a stickier skill signal (within-GM autocorrelation ~0.48 vs WAB's ~0.38).
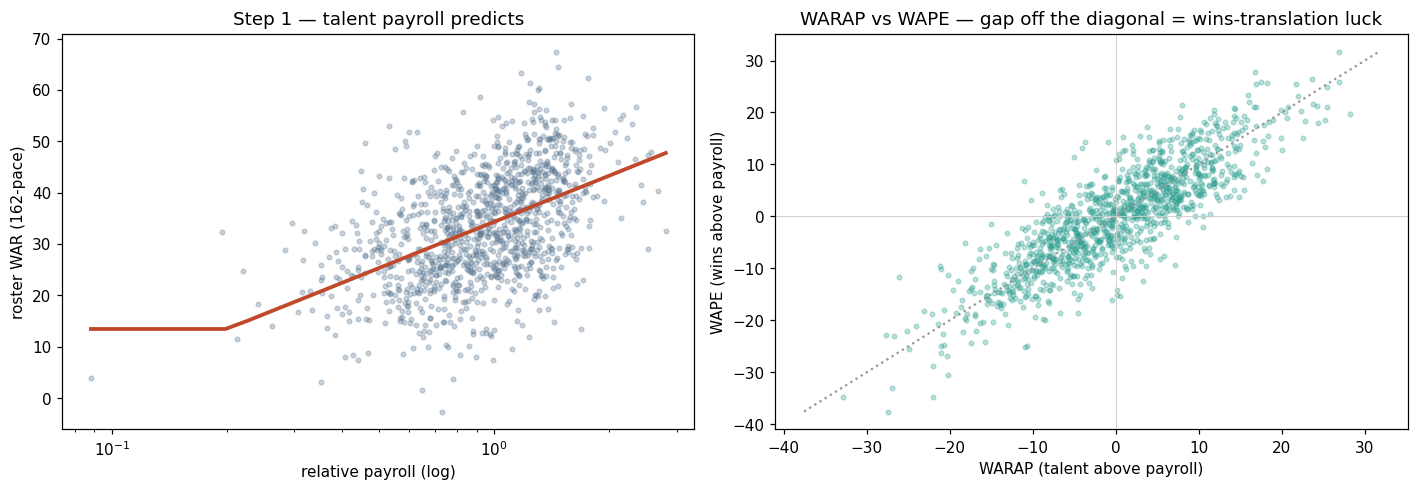
In the right-hand panel, a team above the diagonal won more than its talent (good wins-luck); below, it won less. The vertical gap between a team's TAB and WAB is exactly the part a front office doesn't control. Use TAB to judge the executive, WAB to judge the season's bottom line.
Every full team-season (1985–2025) bucketed by its TAB that year:
| TAB that season | team-seasons | made playoffs | won pennant | won WS |
|---|---|---|---|---|
| > +15 | 50 | 80% | 24% | 10% |
| +5 to +15 | 311 | 55% | 14% | 7% |
| −5 to +5 | 445 | 20% | 4% | 2% |
| −15 to −5 | 291 | 3% | 1% | 1% |
| < −15 | 61 | 2% | 0% | 0% |
Same monotonic climb as WAB but a touch shallower at the extremes — because TAB strips out the wins-luck that lets a merely-good roster overshoot into the playoffs. It's measuring the talent you built, not the record it happened to produce.
Inputs: full-roster fWAR = 47.2 (full season, so WAR₁₆₂ = 47.2). relpay 0.70 → \(\ln = -0.357\).
1. predicted WAR₁₆₂ \(= 34.3 + 13.0\times(-0.357) = 29.7\)
2. \(\text{TAB} = 47.2 - 29.7 = \mathbf{+17.5}\)
Oakland assembled ~18 WAR more talent than a bottom-tier payroll should buy. Note TAB (+17.5) sits below their WAB (+25.9): the gap is the Pythagorean/sequencing luck TAB deliberately strips out.
Fit on full team-seasons (≥100 games), 1985–2024/25. All figures are franchise-level outcomes credited to the decision-maker in the relevant year — see the GM profiles for per-executive numbers.