The market dollar value of a player's production minus what he was actually paid — how much free money a front office extracted from its roster.
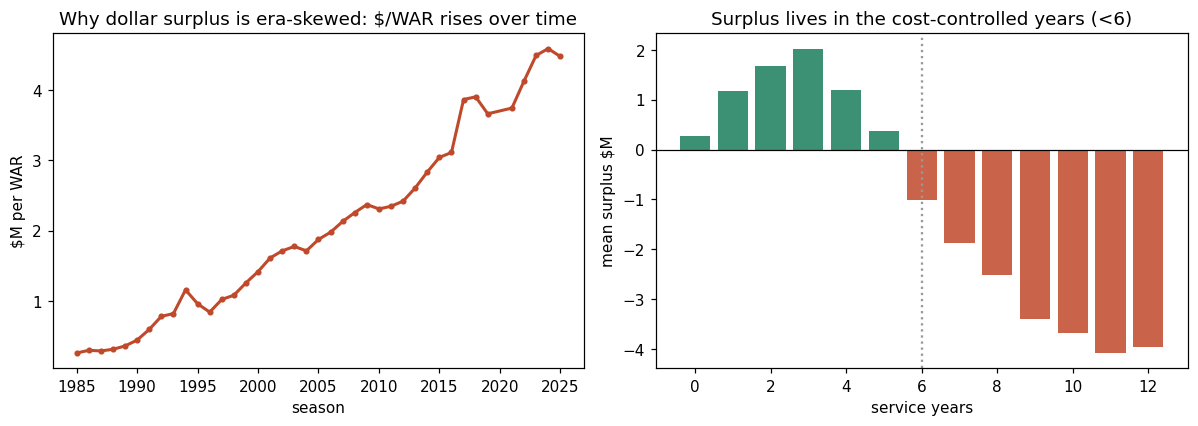
Every win on the open market has a price. Surplus asks: did you get your WAR for less than that price? A pre-arbitration star producing 6 WAR on a $0.7M salary is worth tens of millions in surplus; a $30M free agent producing 1 WAR is deep negative. It's the purest efficiency number — dollars of value created per roster decision.
First recover each season's market price of a win, \(r_t\) — total industry salary divided by total positive WAR produced that year:
\[ r_t = \frac{\sum_i \text{salary}_{i,t}}{\sum_i \max(\text{WAR}_{i,t},\,0)} \]A player's surplus is then his WAR valued at that rate, minus his actual salary:
\[ \text{Surplus\$} = \text{WAR}\times r_t - \text{salary} \]Summed over a roster (or a GM's tenure) it gives total dollars of value extracted above cost. Because \(r_t\) is computed per season, the metric absorbs salary inflation — a 1990 dollar and a 2025 dollar are each priced against their own market.
Note: the Trade Database and Trade Calculator use a tier-adjusted version of this same idea — same era-neutralized rate, but multiplied by a talent-tier factor (0.65× for replacement, 1.6× for superstars) calibrated to the empirical FA market. See Grading Trades for the tier table. The roster/GM surplus on this page uses the flat rate \(r_t\) directly — it's the across-the-board efficiency lens and is the right number for "how cheaply did you build this roster overall."
Every team-season (1985–2025) bucketed by its total roster surplus $M. Notice how flat and non-monotonic this is compared with WAB:
| Roster surplus that season | team-seasons | made playoffs | won pennant | won WS |
|---|---|---|---|---|
| > +$40M | 45 | 62% | 4% | 0% |
| +$20M to +$40M | 59 | 44% | 10% | 5% |
| $0 to +$20M | 267 | 28% | 7% | 2% |
| −$20M to $0 | 460 | 21% | 6% | 3% |
| < −$20M | 357 | 29% | 7% | 5% |
The bottom bucket — the biggest overspenders — actually makes the playoffs 29% of the time (they bought wins at a loss), more often than break-even teams. Only the very top bucket (+$40M, usually a wave of cheap young stars who also pile up WAR) clearly contends. And the WS column is flat at 0–5% across every bucket: surplus has essentially no link to titles. Efficiency is a skill, but it is not the same thing as winning.
Inputs: 10.1 WAR on a $0.51M (pre-arb) salary. The 2013 implied market price of a win (from the complete-roster data) was \(r_{2013}\approx\$2.6\text{M/WAR}\).
1. market value \(= 10.1\times 2.6 = \$26.4\text{M}\)
2. \(\text{Surplus\$} = 26.4 - 0.51 = \mathbf{+\$25.9\text{M}}\)
One of the largest single-season surpluses on record — an MVP-level season bought at the league minimum. The Angels' problem was never Trout's value; it was failing to surround that surplus with contention.
Fit on full team-seasons (≥100 games), 1985–2024/25. All figures are franchise-level outcomes credited to the decision-maker in the relevant year — see the GM profiles for per-executive numbers.