Each acquisition's fair share of the playoff-odds boost its season's deals bought over the roster already on hand. Graded once, at the deal — did the GM buy wins where they actually move the needle?
Every acquisition (free-agent signing or trade) is graded once, in the season its wins first reach the roster, by the playoff-probability points it added to that team. It rewards the decision — buying wins onto a roster close enough to contention that those wins flip the odds — and it does not re-credit a player every year you keep him. One deal, one event, in its arrival year.
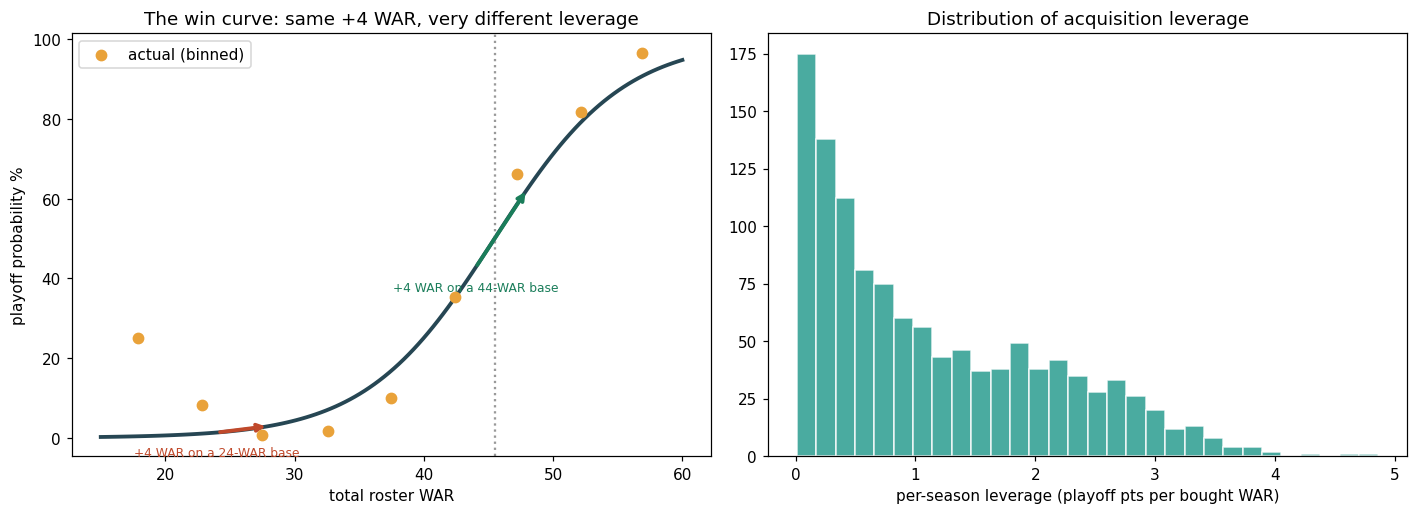
Playoff probability is an S-curve in roster WAR. Fit a logistic on every full team-season (1985–2025):
\[ P(\text{playoff}\mid W) = \sigma(\alpha + \beta W), \qquad \sigma(x)=\frac{1}{1+e^{-x}} \]The slope \(\frac{dP}{dW}=\beta\,\sigma(1-\sigma)\) is maximal at the ~45-WAR threshold and ≈ 0 in the tails. Fitted: P = σ(−12.99 + 0.288·W); ceiling slope ≈ 7.2 pts/WAR.
The curve is one cross-era standard. Strike- and COVID-shortened seasons (1994, 1995, 2020) are held to a 162-game WAR pace, so a 60-game club isn't mistaken for a 17-WAR team; and the two format-broken years are dropped from the fit itself — 1994 (postseason cancelled) and 2020 (a 16-team field). It deliberately does not adjust for the changing wild-card count or divisional opponent strength, so a GM's leverage stays comparable across eras rather than tracking how generous the league's playoff format happened to be that year.
In a season the new acquisitions together lift the team from the baseline it already had — the home-grown core plus holdovers, base = W − (that year's new WAR) — up to its finished total W. That collective boost is unambiguous:
To hand each deal its share we use the Shapley value — average each acquisition's marginal contribution over every order it could have been stacked onto the base. It is the unique split that is order-free (no deal is penalized for being "first" or "last") and that sums exactly to the season's boost, so a GM's deals add up with no double-counting. Aggregate over the tenure and divide by the WAR bought:
\[ \text{Acquisition Leverage} = \frac{\sum_\text{deals}\text{Shapley}}{\sum w} = \frac{\sum_\text{seasons}\text{boost}}{\sum w}\quad\text{(playoff points per bought WAR)} \]Why not just grade each deal against the finished roster, \(P(W)-P(W-w)\)? That over-credits every star on a stacked roster — each gets full credit for the same threshold crossing. The 2024 Dodgers' deals summed that way to 96 points of a real 86; Ohtani alone read 52 instead of his fair 43. Shapley removes the double-count.
This is the stickiest metric on the site, and it still predicts an October it was never fit on.
We don't publish a "playoff rate by leverage bucket" table: leverage is defined from the playoff-probability curve, so binning it against playoff rate would be circular. Its honest validation is the one above — it forecasts pennants and World Series, outcomes it was never fit on.
The returning core (home-grown + holdovers) was 32 WAR — a ~2% playoff team on the curve. That winter's acquisitions (Ohtani, Glasnow, Teoscar Hernández, Edman…) carried the roster to 52 WAR / ~88%:
1. season boost \(= [\,P(52)-P(32)\,]\times100 = 88 - 2 = \mathbf{+86}\) pts — shared by the whole class.
2. Ohtani's Shapley share of that 86 (averaging his 9-WAR marginal over every stacking order) is +43 pts. Grading him against the finished roster instead would read +52 — but then Ohtani, Glasnow and Teoscar each bank the same threshold crossing and the class sums to 96, more than the 86 it really bought.
Shapley keeps every deal's credit real and additive: the 14 deals sum to exactly the +86 the Dodgers actually gained. Ohtani was still a monster — just not single-handedly 2%→88%.
Fit on full team-seasons (≥100 games), 1985–2024/25. All figures are franchise-level outcomes credited to the decision-maker in the relevant year — see the GM profiles for per-executive numbers.