How much of a team's contention is carried by acquired (FA/trade) talent rather than home-grown — counted every season that talent stays on the roster.
Each season, split the roster's WAR into the home-grown base (players who entered as the club's own amateur) and the acquired (FA + trade) WAR on top. Acquisition Reliance is the playoff probability your roster owes to that acquired talent — measured every season the players remain, not just the year they arrived. It answers "how much of this team's contention was bought rather than grown," summed across the tenure.
It is a roster-state stat: ~82% of it comes from acquired players in seasons after the year they were acquired, so it measures sustained reliance on the trade/FA market — not the timing or quality of individual deals (that's PPA).
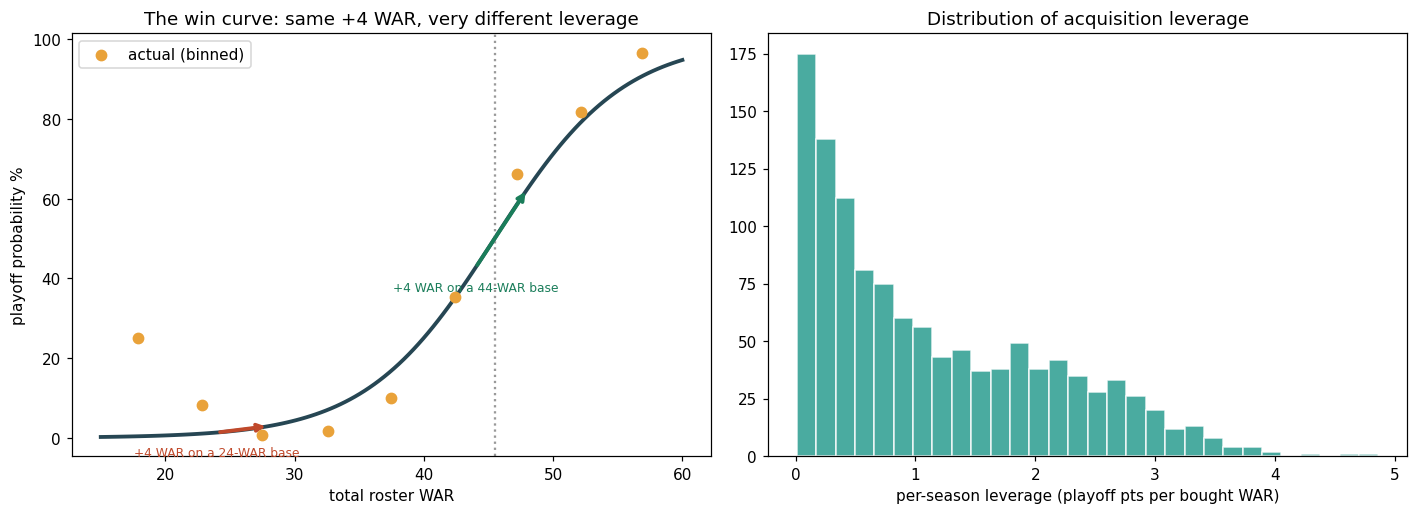
Playoff probability is the same S-curve, P = σ(−9.09 + 0.200·W), maximal near the ~45-WAR threshold. Each season's reliance is the lift from the acquired WAR stacked on the home-grown base:
Inputs: home-grown base \(W_\text{base}=45.2\), acquired \(W_\text{acq}=16.6\), total = 61.8 WAR.
1. \(P(45.2)=\sigma(-9.09+0.200\times45.2)=\sigma(-0.05)=0.488\) — the home-grown core alone was a ~50% playoff team, right at the threshold.
2. \(P(61.8)=\sigma(3.27)=0.963\)
3. \(\text{lev}=(0.963-0.488)\times100 = +47.5\) playoff points the acquired talent was responsible for.
4. per acquired WAR: \(47.5/16.6 = \mathbf{2.9}\) — Los Angeles leaned heavily on bought talent sitting on the steepest part of the curve.
Fit on full team-seasons (≥100 games), 1985–2024/25. All figures are franchise-level outcomes credited to the decision-maker in the relevant year — see the GM profiles for per-executive numbers.